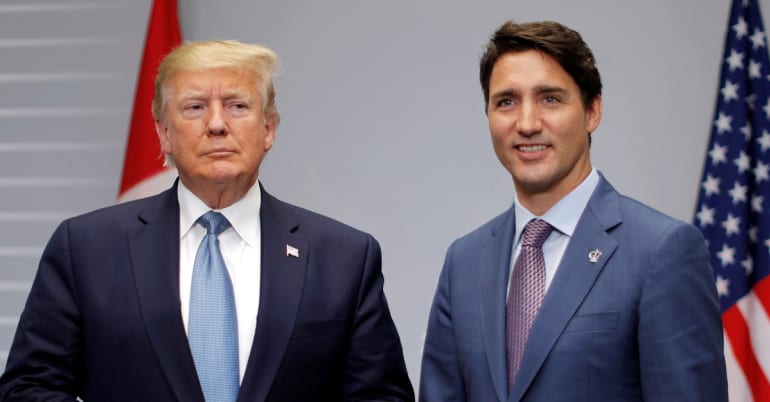


Two topics are front-of-mind for many investors right now. First, gains by non-US technology stocks are challenging the dominance of the Magnificent 7 in recent years. Second, the trade war breaking out as the Trump administration attempts to reduce the US trade deficit. For good reason, the latter is dominating economists’ workflow as they address the gap between the perception and the reality of the impacts of higher US trade levies.
The perception is simple: if the US imposes tariffs on American imports, these will become more expensive for domestic consumers and businesses, increasing inflation. Yet in 2018, tariffs did not impact official inflation figures (something the Trump administration hasn’t failed to point out). There are two ways to approach this debate: we can analyse history to understand if, in general, increased tariffs systematically lead to inflation; and we can look at the details of how the Trump administration previously implemented tariffs.
In the first of a two-part series on this topic, we explore the use of tariffs in the past 125 years.
In the late 18th century, an experiment with tariffs not dissimilar to the one being planned now took place in the US. At the time, the US was on the brink of industrialisation and railroad construction, and Europe’s technological advancement weighed on American industry. As a result, Republicans sought to impose significant tariffs on imports – particularly from Europe – and 10% tariffs at the beginning of the 19th century climbed to more than 50% by mid-century.
The Republicans favoured tariffs over taxation, as they were concerned that direct taxes would harm the budding American economy. Collecting revenue from trading partners instead was seen as a way to shift the tax burden toward consumers and foreign companies. This double effect was central to the drafting of the Tariff Act of 1789. The effect was substantial: nearly 90% of US Treasury receipts came from these tariffs. They remained until the end of the 19th century. The Democratic administration under Woodrow Wilson upended the tariff regime with the Underwood Act in 1913.
Figure 1 shows the evolution of implemented tariffs since 1900 in the US, UK and France, allowing for a historical comparison between these three developed economies over time. As can be seen, the three countries haven't experienced a marked increase in tariffs since the 1950s. Once implemented, President Trump's 2018 tariffs only led to a 2% increase in the level of effective tariffs, which partially explains their subdued impact on domestic inflation at the time.
Read also: Trump’s tariffs: inflationary after all?
However, there is one period that shows a more marked and simultaneous increase in tariffs. During the 1930s, US tariffs increased from 5% to 20% (with even higher figures for a subset of imported products). This led both France and the UK to respond decisively. President Roosevelt eventually reversed course as part of his New Deal, returning to the path of free trade against the backdrop of what would later become the General Agreement on Tariffs and Trade, the multinational consensus that led to the formation of the World Trade Organisation. This phase of economic history seemed to have been well and truly established, until 2018.
FIG 1. Effective tariffs between the US, UK and France, 1900-20241

What can this history of tariffs teach us about how the levies influence inflation? Furthermore, can we differentiate between the impacts of a unilateral tariff increase and a series of multilateral increases – i.e. a real trade war? Figure 2 estimates the effect on US inflation from these situations, isolating both the immediate response to tariff increases (on a yearly scale) and the future inflation response.
FIG 2. How US inflation responded to tariff increases, 1900-20242

Read also: Higher US tariffs: winners and losers
In our view, the key conclusions from this analysis are:
A crucial point is that beyond a certain level, tariffs tend to become recessionary, pushing inflation down in the wake of deteriorating growth. This effect is even more pronounced when tariffs become reciprocal in a trade war. Christine Lagarde, President of the European Central Bank, has warned leaders not to go down this path. As we know all too well from the 1930s experience, the real risk of withdrawing from free trade is recession.
For us, maintaining a balanced allocation across asset classes makes sense as geopolitical and nominal uncertainty continues amid positive equity and commodities trends. Our market exposure remains at a steady level of 150% for our Balanced solution. We maintain a 60% allocation to diversifying assets and 40% to cyclical assets.
Simply put, history tells us the inflationary effect of tariffs could fast mutate into a recessionary scenario – if they are significant and become reciprocal.
The most recent evolution of our proprietary nowcasting indicators for global growth, global inflation surprises, and global monetary policy surprises are designed to track the recent progression of macroeconomic factors driving the markets.
Our nowcasting indicators currently show:
World growth nowcaster: long-term (left) and recent evolution (right)

World inflation nowcaster: long-term (left) and recent evolution (right)

World monetary policy nowcaster: long-term (left) and recent evolution (right)

Reading note: BWB’s nowcasting indicator gathers economic indicators in a point-in-time manner in order to measure the likelihood of a given macro risk – growth, inflation surprises and monetary policy surprises. The nowcaster varies between 0% (low growth, low inflation surprises and dovish monetary policy) and 100% (high growth, high inflation surprises and hawkish monetary policy).
important information.
For professional investors use only
This document is a Corporate Communication for Professional Investors only and is not a marketing communication related to a fund, an investment product or investment services in your country. This document is not intended to provide investment, tax, accounting, professional or legal advice.
Read more.